The Shopify Analytics Dashboard That Goes Beyond GA4: Looker Studio + BigQuery
A senior engineer's guide to building a real Shopify analytics stack on Looker Studio and BigQuery. KPI architecture, ETL pipelines, when to template vs build, and the CFO-grade reporting Shopify Analytics will never give you.
13 min read
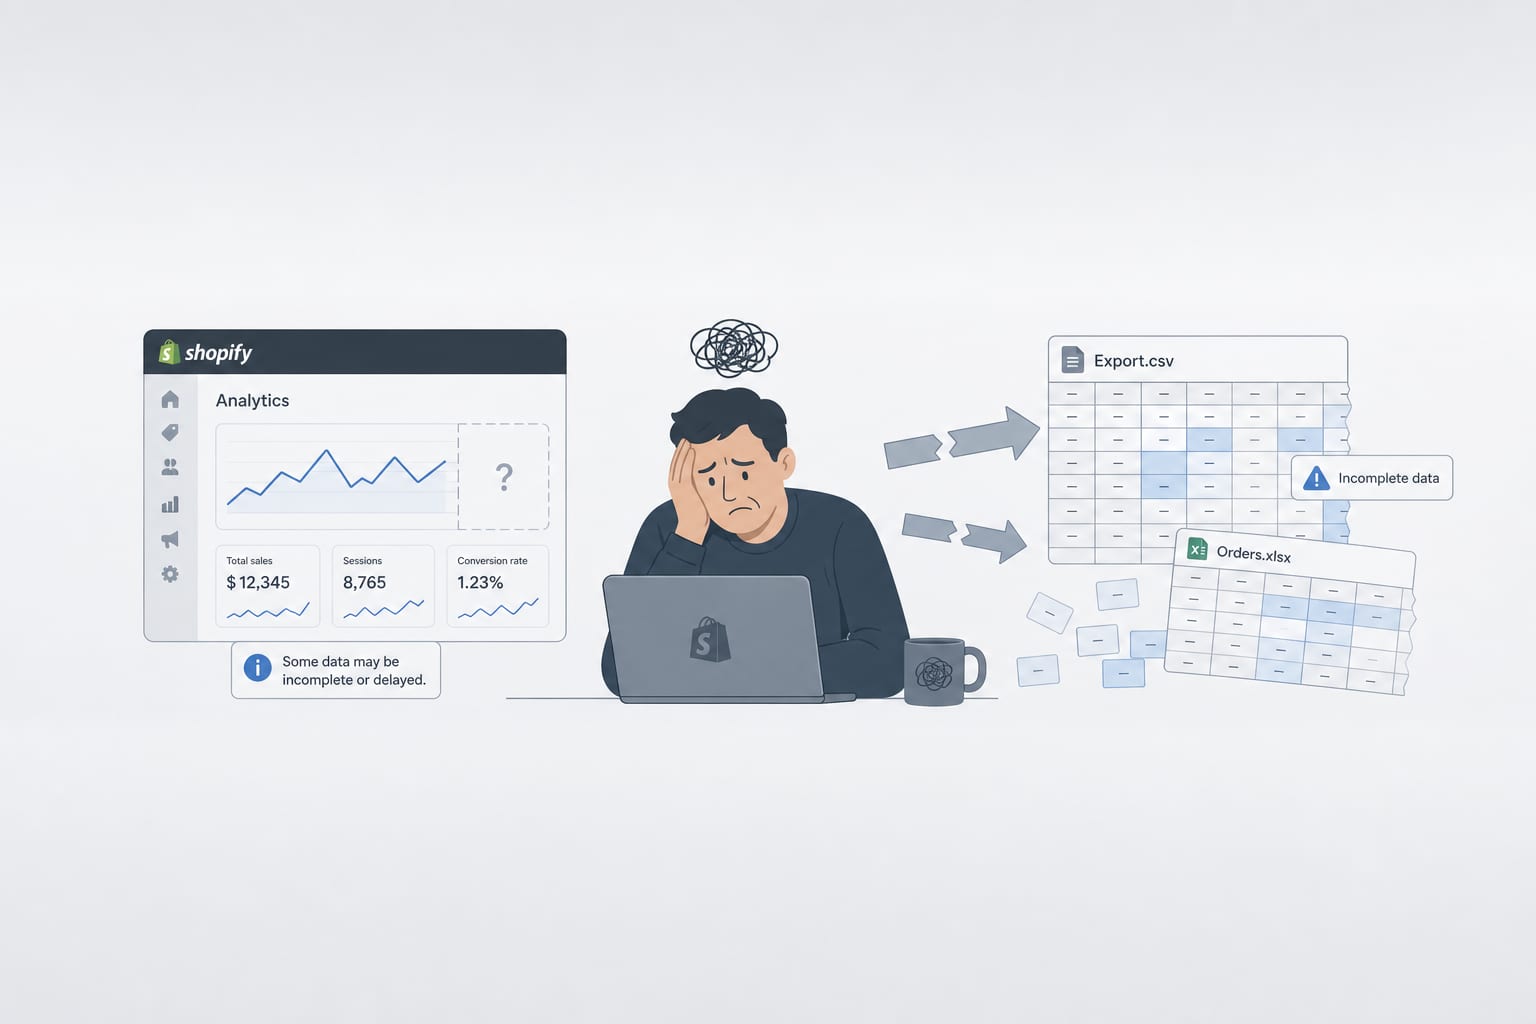
Shopify's built-in analytics is fine for the operational metrics a store manager needs to keep the day running. It is not what your CFO wants. It is not what your marketing director needs to evaluate ad spend across channels. It is not what your operations lead needs to forecast next quarter's inventory. The merchants who outgrow Shopify Analytics do not need a "better dashboard"; they need a real BI stack, and the question is what to build, how much it costs, and where the line is between "buy a template" and "engineer the answer."
This post is the BI architecture we deploy at Sentinu for Shopify clients who have hit the limits of built-in reporting and decided to invest in real analytics infrastructure. It builds directly on our server-side tracking post (which gave you clean, complete event data) and answers the next question: now that the data is reliable, where does it live and how does it become decisions?
What Shopify Analytics cannot do
Three categories of questions that Shopify's native dashboards do not answer well, and that every growing store needs answered:
Profitability at the SKU level after returns, refunds, ad spend, and fees. Shopify shows you revenue. It does not show you net profit per SKU after subtracting blended customer acquisition cost, the actual transaction fees, return rates by SKU, and the cost of the inventory still sitting in the warehouse. CFO-grade decisions need this number; Shopify Analytics never gives it to you.
Cross-channel attribution. A customer sees your Meta ad on Tuesday, opens an email on Wednesday, clicks a Google search ad on Thursday, and converts on Friday. Shopify Analytics shows you Friday. GA4 with attribution modeling gets closer but still struggles with offline channels (wholesale, in-person, B2B sales rep). Real BI joins Shopify orders to ad spend data, email engagement data, and any other channel that touched the customer journey.
Cohort analysis across the customer lifecycle. Customer LTV by acquisition cohort. Repeat-purchase rate by first-product purchased. Subscription churn by subscription tier. These questions need data that crosses time periods and joins customer records across orders, products, and marketing events. Shopify's native cohort reports are basic; real cohort analysis lives in a data warehouse.
Multi-store or omnichannel reporting. A brand running two Shopify stores plus a wholesale operation plus a retail presence needs consolidated reporting across all four. Shopify reports are per-store. You consolidate by exporting and joining elsewhere, or by living in a BI tool that pulls from all four sources.
The architecture
The stack we deploy for serious Shopify analytics in 2026 has four layers:
The architectural decisions worth highlighting:
BigQuery as the warehouse, not as a "Shopify connector destination." The data warehouse is the persistent layer that holds everything: Shopify, GA4 (via the BigQuery export), Google Ads, Meta Ads, email platform engagement, NetSuite or your ERP if applicable. Looker Studio queries the warehouse. Everything else is plumbing.
Three schemas, not one giant table. Raw landing zone preserves the source data as-is, with timestamps. Staging cleans, deduplicates, applies business logic (what counts as a "completed order"). Marts are the queryable business-ready tables that Looker Studio reads. This separation lets you re-process the staging and marts layers when business rules change without re-pulling from the source.
Looker Studio as the presentation layer, not the warehouse. Looker Studio's native connectors to Shopify or GA4 are fine for the simplest dashboards. For real analytics, the connector points at BigQuery, and BigQuery does the heavy lifting. This separation matters because Looker Studio's data extracts are limited and slow on large datasets; BigQuery handles billions of rows comfortably.
When to template, when to build
The most common merchant question at this point: "Can I just use one of the Looker Studio templates from Supermetrics or Coupler?"
Honest answer: yes, for the first 60 percent of what you need. The pre-built templates from Supermetrics, Coupler, Two Minute Reports, Power My Analytics, Funnel, and similar vendors cover the standard ecommerce KPIs (revenue trends, top products, conversion funnel, basic customer segmentation). They are templated specifically because these patterns generalize. If your reporting question is "show me sales by product over time," a template handles it.
The templates break down at the same point Shopify Analytics breaks down: when the question requires joining data across sources, computing custom metrics that involve business-specific logic, or surfacing KPIs that depend on data the connector does not expose.
The line we draw at Sentinu:
Use a template when: the question can be answered by Shopify data alone. The connector covers the metric. The presentation is the value. You want a working dashboard in a day, not a week.
Build custom when: the question requires joining Shopify with ad spend, ERP data, or custom event tracking. The metric requires business-specific logic (custom margin formulas, custom attribution windows, custom cohort definitions). The audience is executive-level and needs presentation tailored to specific decisions.
A real BI engagement is usually both. Templates for the operational dashboards, custom for the strategic ones.
The ETL layer: where the engineering actually happens
The data warehouse is the layer that determines whether your analytics scale. The Shopify connector you choose to populate it matters more than the dashboard you put on top.
Fivetran. The expensive default. $150 to $1,500+ per month for Shopify alone depending on monthly active rows. Battle-tested. Strong schema mapping. Handles incremental loads, schema drift, and historical backfills cleanly. Use when reliability matters more than cost, which is most enterprise scenarios.
Stitch. Cheaper alternative ($100 to $500/month). Less mature schema handling. Works for mid-market stores with reasonable data volume. The historical-backfill story is rougher than Fivetran.
Airbyte (self-hosted or cloud). Open-source, self-hostable. $0 if you run it yourself, $100 to $1,000/month for Airbyte Cloud. Same architectural pattern as our self-hosted n8n setup. Right answer for teams that want EU data residency and have the DevOps capacity.
Custom Python on AWS Lambda. What we build for clients who score high on data sovereignty (a French regulated industry, for instance) or have unusual transformation requirements. A Lambda that pulls from the Shopify Admin API on a schedule, transforms, and writes to BigQuery. Costs $20 to $200/month in AWS. Costs $30K to $60K to build initially. Right answer for the small number of clients where off-the-shelf does not fit.
The pattern across these: the right tool depends on the same axes that decided the Shopify NetSuite integration choice last week. Data volume, customization need, in-house engineering capacity. The framework transfers.
What goes in the marts schema
The marts layer is where business logic lives. Examples of tables we build for typical Shopify analytics projects:
fact_orders. One row per order. Includes order ID, customer ID, currency, gross revenue, discount amount, tax, shipping, refunded amount, net revenue, order country, channel, fulfillment status, and timestamps. Joined to customers and products for downstream analysis.
fact_line_items. One row per order line item. Includes SKU, product ID, variant ID, quantity, unit price, cost of goods sold (joined from product cost data), and refund-adjusted quantities. The grain at which margin analysis happens.
dim_customers. One row per customer with derived attributes: first-order date, last-order date, total orders, total revenue, total discounts received, customer LTV, RFM segments (recency, frequency, monetary), and acquisition channel. Recomputed nightly.
dim_products. One row per product variant with current and historical pricing, cost, inventory levels, return rate, average margin, and category attributes.
fact_marketing_spend. Daily marketing spend per channel (Google Ads, Meta, email, affiliate). Joined to order revenue for return-on-ad-spend calculations. This is the table that lets you answer "what was the ROAS by campaign last quarter."
fact_customer_cohorts. Cohort table grouping customers by acquisition month, with revenue and retention measured at 1, 3, 6, 12, and 24 months post-acquisition. This is the table that answers "are our newer cohorts converting and retaining better or worse than last year's."
These are starting points. Specific clients need additional tables for subscriptions, B2B accounts, wholesale orders, or operational metrics. The pattern is the same: one fact table per business event, one dimension table per entity, marts queryable directly by Looker Studio.
💡
The hardest part of building a Shopify BI stack is not the dashboards. It is the dimension and fact table design. Get this wrong and every dashboard built on top has the wrong answer. Get this right and adding new dashboards is a Looker Studio drag-and-drop exercise. Invest the engineering time at this layer.
The dashboards that actually get used
Across our BI clients, the dashboards that get opened daily versus the ones that get built and forgotten follow a pattern. The successful ones share three properties:
They answer one specific question. "Exec daily KPI" dashboards that try to show 40 metrics on one page do not get used. "Daily revenue versus target with channel attribution" dashboards do. The discipline is naming the question the dashboard answers before building it.
They surface action, not just data. A dashboard that shows yesterday's CAC is informational. A dashboard that shows yesterday's CAC alongside the threshold at which you should pause the campaign is actionable. The good dashboards include thresholds, targets, and color-coded health states.
They are tied to a meeting or a decision. The Monday marketing review dashboard. The CFO month-end close dashboard. The weekly inventory replenishment dashboard. Dashboards without a decision attached drift into disuse within weeks.
The dashboards we typically build for a Shopify Plus client:
| Dashboard | Audience | Frequency | Key tables |
|---|---|---|---|
| Exec daily KPIs | CEO, leadership | Daily | fact_orders, fact_marketing_spend |
| Marketing performance | CMO, marketing team | Daily/weekly | fact_marketing_spend, fact_orders, dim_customers |
| CFO finance close | CFO, finance | Monthly | fact_orders, fact_line_items, dim_products |
| Product profitability | Merchandising | Weekly | fact_line_items, dim_products |
| Customer cohorts and LTV | Strategy, finance | Quarterly | dim_customers, fact_customer_cohorts |
| Inventory and replenishment | Operations | Daily | dim_products, fact_orders |
| Subscription health (if applicable) | Product, finance | Weekly | Custom subscription tables |
Each is a separate Looker Studio report. Each pulls from the same BigQuery marts. Each is scoped to one audience and one decision.
What this costs
Honest infrastructure cost for a Shopify Plus store with 50K orders per month, 100K customers, the standard BI stack:
| Component | Monthly cost |
|---|---|
| Fivetran (Shopify connector, ~50K MAR) | ~$300 |
| BigQuery storage (10GB compressed) | ~$2 |
| BigQuery query compute (~500 GB scanned/month) | ~$5 |
| Looker Studio | $0 |
| Optional: Google Ads / Meta Ads connectors | ~$200 |
| Total monthly | ~$510 |
Engineering setup cost for a clean implementation: $25K to $60K depending on the number of marts tables, the complexity of business logic (custom margin formulas, subscription metrics), and the number of dashboards.
Ongoing maintenance: typically 1 to 2 days per month of analytics engineering work to update marts logic, add new dimensions as the business evolves, and tune queries. Smaller stores can run unattended for months; larger ones with active product launches and marketing changes need more attention.
Compare to alternatives: a managed BI tool like Triple Whale starts at $300/month and scales rapidly with store size; Polar Analytics is $300 to $1,500/month. These tools are right when the team has no engineering capacity and the analytical needs map onto their pre-built reports. They are wrong when the team has the engineering capacity and wants to build the metrics specific to their business.
When to skip the BigQuery layer entirely
The honest counter-case. Not every Shopify store needs BigQuery.
Stores under $5M annual GMV with simple analytical needs. The volume of data does not justify the warehouse complexity. A direct Looker Studio connector to Shopify, plus the GA4 native connector, plus a Supermetrics template for ad spend, covers 80 percent of the need at one tenth the cost.
Teams with zero engineering capacity. A BigQuery setup needs someone who can write SQL, debug data pipeline failures, and update marts as business logic changes. If the team is purely marketing-and-ops, a managed BI tool (Triple Whale, Polar Analytics, Glew) is the right answer even though it costs more.
Highly tactical use cases. A team that wants "campaign performance this week" gets there with a template. A team that wants "LTV by acquisition cohort with cross-channel attribution" needs the warehouse.
The deciding question is not store size but analytical sophistication. We have seen $20M brands run perfectly well on direct Looker Studio connectors and $3M brands genuinely needing a warehouse because their business is subscription-heavy with complex cohort analysis. The store's annual GMV is a weak proxy for analytical complexity.
FAQ
Why BigQuery and not Snowflake or Redshift?
For a Shopify analytics stack hosted alongside GA4 (which exports natively to BigQuery), BigQuery is the path of least resistance. Snowflake is more flexible across cloud providers and has better governance features for large enterprises. Redshift is the natural choice for AWS-heavy stacks. For a mid-market Shopify store with GA4 as a primary data source, BigQuery wins on integration and cost.
What about Power BI for Shopify?
Power BI is the right call for organizations standardized on Microsoft (Office 365, Azure, Dynamics). It connects to Shopify via partner connectors (similar story to Looker Studio) and to BigQuery, Snowflake, or Redshift. The dashboard tool choice (Looker Studio vs Power BI vs Tableau) is secondary to the warehouse architecture. Pick the dashboard tool your audience already uses.
How long does a BI implementation take?
From kickoff to first usable dashboards: 6 to 10 weeks for a focused implementation (one connector, one warehouse, four dashboards). Larger projects with multi-source data, custom business logic, and 10+ dashboards run 3 to 5 months. The variable is the marts design complexity, not the technology.
Can I do this myself without an agency?
Yes, if you have a data engineer or analytics engineer on the team. The Fivetran-BigQuery-Looker Studio stack is well-documented and the connector setup is mostly point-and-click. The hard part is the marts design, which requires both data engineering skill and business context to do well. Teams that have skipped this step end up with dashboards that show the wrong number to executives.
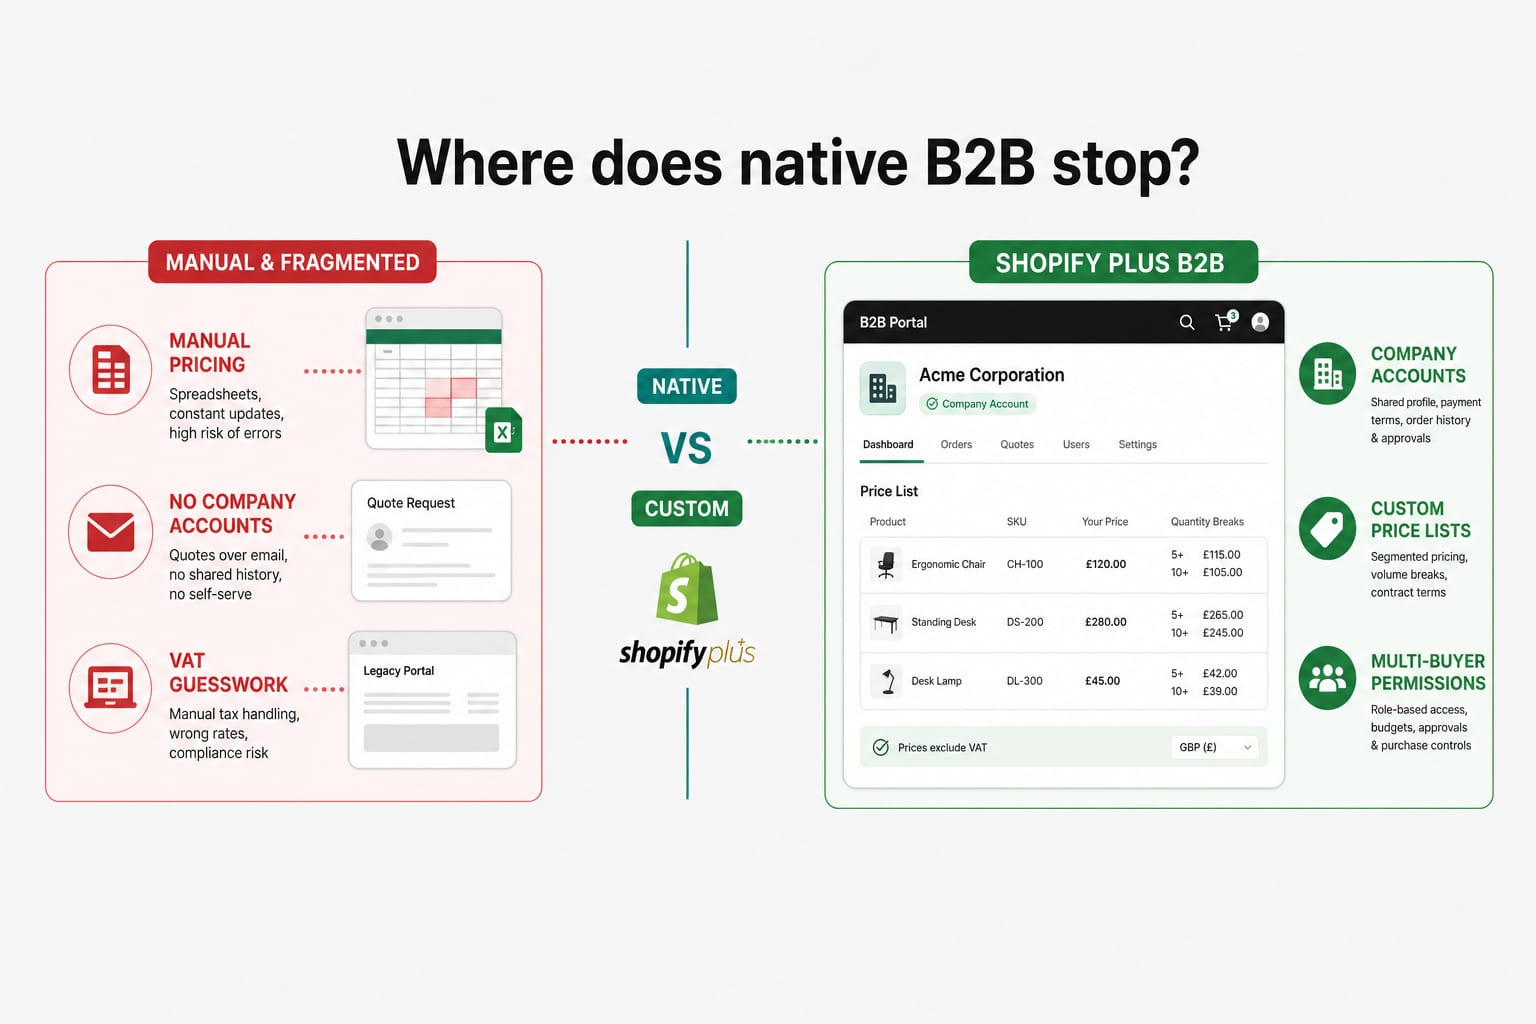
How does this work with Shopify B2B?
B2B orders flow into the same Shopify Admin API and the same Fivetran connector. They appear as orders with a Company association rather than a direct customer. The marts schema needs a dim_companies table joined to dim_customers, and B2B-specific fact tables for things like price-list usage and net-terms invoicing. Same architecture, additional dimensions. We covered the B2B layer in our Shopify Plus B2B post.
What about real-time dashboards?
BigQuery is not designed for sub-second latency. If your dashboard needs to update within seconds of an order, you are looking at streaming architectures (Pub/Sub, Kinesis, ClickHouse) that are more expensive and complex. For 99 percent of business analytics, hourly or daily refresh is sufficient. We use real-time only for specific operational dashboards (live order monitoring during a sales push) and accept the additional cost there.
How does GDPR affect the BI stack?
BigQuery offers EU regions. Fivetran offers EU data residency on appropriate tiers. Looker Studio is a Google product subject to standard Google data residency commitments. For French clients under RGPD, we configure the stack with EU-region BigQuery, EU-residency Fivetran, and documented data processing agreements. The same architectural pattern as our server-side tracking and self-hosted n8n work; the principles transfer across the data stack.
Where to take this next
If you are scoping a Shopify BI build and the architecture above resonates with what your team needs, that is what our data analytics and BI practice covers. We design the marts schema, build the ETL, and ship the dashboards your team will actually use. If the project also involves cleaning up the upstream tracking layer (so the data in BigQuery is trustworthy in the first place), our server-side tracking post is the prerequisite read. If you are not yet at the volume that justifies BigQuery and want a templated path, the same team can scope you onto a Looker Studio direct setup and earn back the engagement on the warehouse build when you are ready.
Related posts
View all articlesTechnical SEOFeb 17, 2026
Server-Side Tracking for Shopify: A GTM and GA4 Setup That Survives Ad Blockers and GDPR
A senior engineer's guide to server-side tracking for Shopify in 2026. Why ad blockers are eating your data, how to set up GTM server-side on AWS, GA4 configuration, GDPR controls, and what it actually costs.
12 min read
Shopify DevelopmentJun 17, 2026
Building a B2B Wholesale Portal on Shopify Plus in 2026: Native Features, the Limits, and Where Custom Development Starts
Shopify B2B has grown up. For most wholesale operations, the native Plus features cover the basics. For VAT exemption logic, ERP-synced pricing, multi-buyer accounts, and credit terms, the line between native and custom is where most stores get stuck. Here is how to draw it.
12 min read
Shopify DevelopmentJun 10, 2026
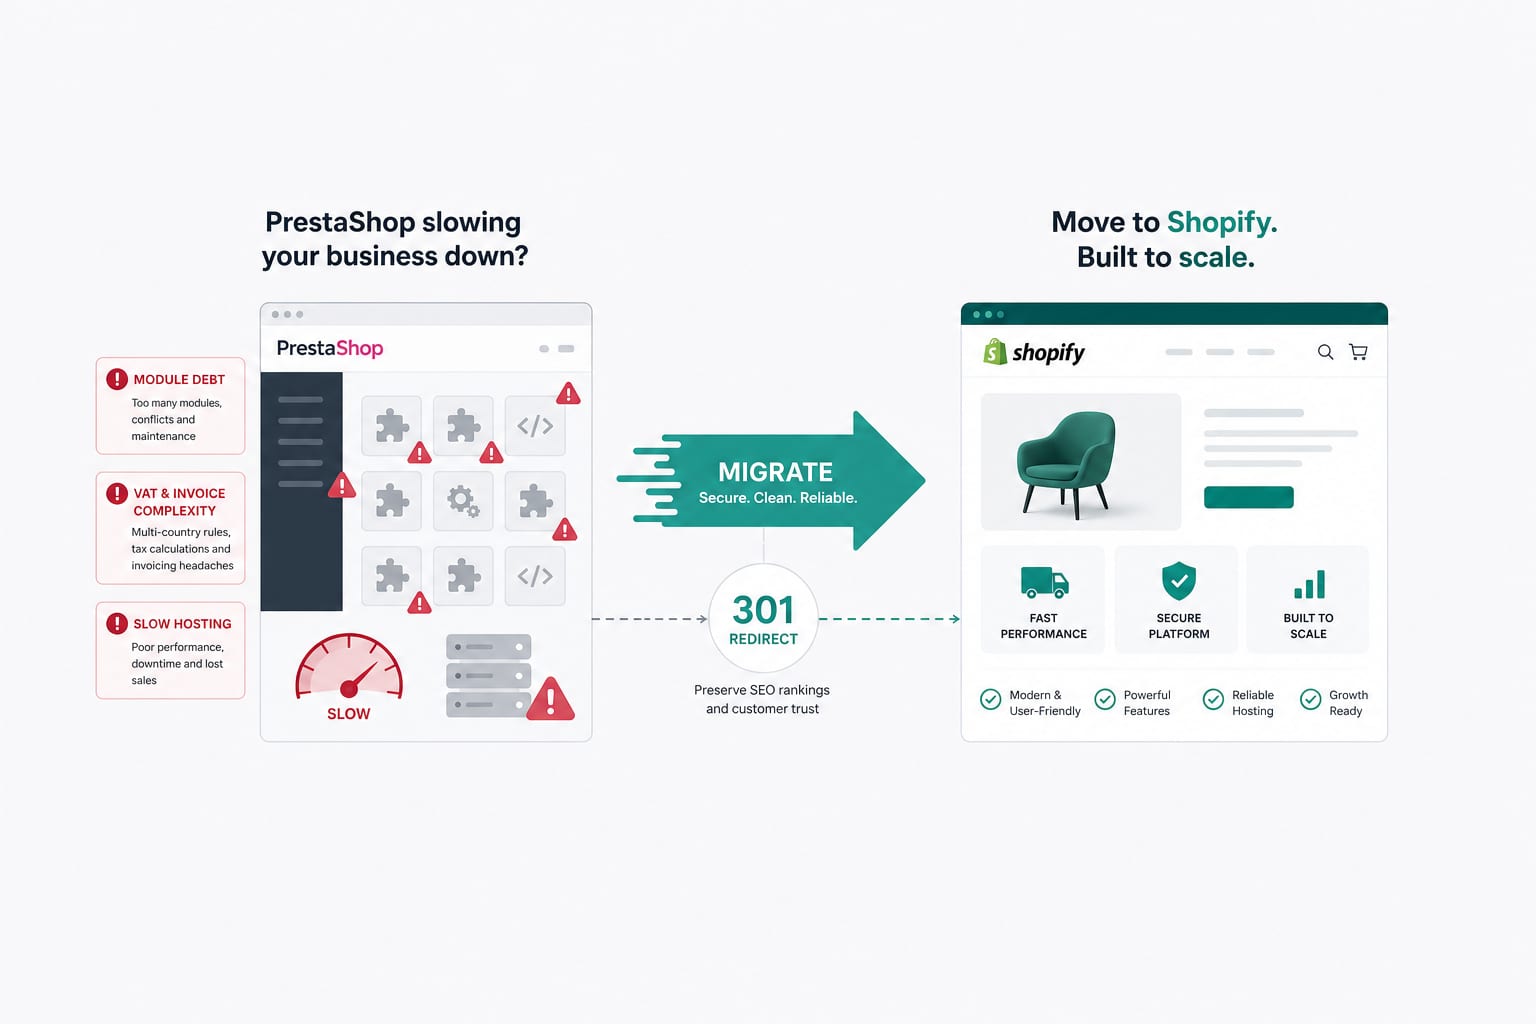
PrestaShop to Shopify Migration in 2026: The French Market Playbook
PrestaShop migrations are not WooCommerce migrations with a different label. The data model, the module ecosystem, the VAT and invoice logic, and the French legal expectations all differ. Here is the playbook we run for French and EU merchants moving from PrestaShop to Shopify.
17 min read