Core Web Vitals and Conversion: The Ecommerce Data Nobody Wants to Hear
The business case for Core Web Vitals on ecommerce sites, in numbers. Real conversion impact data from Vodafone, NDTV, Carpe, Rakuten, and 30 other case studies. What 100ms of LCP actually costs you per month.
13 min read
If you read our Core Web Vitals audit checklist post, you have the technical playbook. This post is the one to forward to whoever signs the engineering budget. It is the business case for performance, in real numbers, from real ecommerce stores. The data is not subtle: every 100 milliseconds of page-load delay translates into measurable conversion loss, and the cumulative cost of a slow Shopify store is almost always larger than the cost of fixing it.
This is the data that makes Core Web Vitals work get approved. It is also the data that makes it stop being approved on the projects where it does not pay back, because we will be honest about those cases too.
The headline numbers
Compiled from web.dev case studies, Deloitte and Google's joint "Milliseconds Make Millions" study, and our own engagement data:
- Every 100ms of LCP improvement correlates with a 1.11 percent lift in session-based conversion rate (Deloitte study for eBay)
- Vodafone improved LCP by 31 percent and saw an 8 percent lift in sales and a 15 percent improvement in lead-to-visit rate
- NDTV reduced LCP by 55 percent and saw a 50 percent decrease in bounce rate
- Rakuten 24's Core Web Vitals optimization (LCP, FID, CLS) delivered a 33 percent increase in revenue per visitor in A/B tests
- Shopify and Carpe Diem partnership: 52 percent faster LCP, 41 percent faster CLS, conversion rate up 5 percent, traffic up 10 percent, revenue up 15 percent
- Trendyol reduced INP by 50 percent and saw a 1 percent uplift in click-through rate
- Google research: sites that pass all three Core Web Vitals thresholds see 24 percent fewer page abandonment rates
The pattern across these is not "performance helps a little." It is "performance is one of the highest-ROI investments an ecommerce site can make."
The mechanism: why faster sites convert more
The mechanism is not mysterious. Three things happen when a page is faster:
Bounce rate drops. A user who waits 4 seconds for a page to render is in a different psychological state than a user who waits 1.5 seconds. The 4-second user has had time to question whether they really want to be there. They have noticed the discount they did not need. They have heard their phone vibrate. They have started reading a different tab. The 1.5-second user is in flow.
Trust signals fire correctly. A page that visibly shifts as it loads (high CLS), or where the "Add to Cart" button takes 400 milliseconds to respond (poor INP), feels broken. Broken-feeling sites do not get credit cards entered. CLS specifically destroys checkout completion because customers tap the wrong button when the layout moves under their finger.
The funnel compounds. A 5 percent improvement at the category page, a 5 percent improvement at the PDP, a 5 percent improvement at the cart, and a 5 percent improvement at the checkout do not add to 20 percent. They multiply. 1.05^4 = 1.215. A 21.5 percent compound lift across the funnel from a uniform 5 percent stage improvement is a typical outcome of a Core Web Vitals project that touches all templates.
This is why "small" performance wins matter. A 200ms LCP improvement on the homepage looks unremarkable in isolation. The same improvement applied across homepage, collection, PDP, cart, and checkout compounds into a revenue change that is hard to ignore.
What 100ms actually costs you per month
The arithmetic that turns the abstract into the budgetable. For a Shopify store doing $1M annual revenue with a 2 percent baseline conversion rate:
- Annual sessions, assuming a $50 AOV: about 1 million
- Daily sessions: 2,740
- Daily conversions: 55
- 100ms slower LCP equivalent: ~1.1 percent fewer conversions, or about 0.6 conversions per day
- Daily revenue lost: $30
- Monthly revenue lost: $900
- Annual revenue lost: $11,000
That is from a single 100ms delay. A site with a 2.5-second LCP versus a 1.5-second LCP loses ~$110,000 per year of revenue at the same baseline, before considering the SEO ranking effect or the customer lifetime value of the customers who never converted because the first visit was painful.
Scale this up: a $10M Shopify Plus store with a 4-second LCP versus a 1.5-second LCP is leaving $1.1M of annual revenue on the table from performance alone. Performance optimization engagements that cost $20K to $40K and recover even a quarter of that gap pay back in the first quarter.
📊
The numbers above are calculated against the 1.11 percent per 100ms conversion correlation from the Deloitte study, which is conservative versus the higher figures (Akamai's 7 percent per 100ms) you will see quoted elsewhere. We use the conservative number in client conversations because the higher numbers depend on the baseline and rarely generalize. The lower number is enough to make the case.
The case studies in detail
The published data is rich enough that you can find a study that resembles your business.
Vodafone: enterprise B2C, LCP focus
Vodafone optimized LCP on their lead generation pages by addressing image preload, font loading strategy, and third-party script blocking. The results across their European properties: LCP improved 31 percent, sales increased 8 percent, lead-to-visit rate improved 15 percent. The improvement was attributed primarily to the LCP work, with the other vitals improving as side effects.
What translates to ecommerce: the LCP fix on a lead-gen page is fundamentally the same as the LCP fix on a product detail page. Both depend on getting the hero image into the initial HTML, preloading it, sizing it correctly, and serving it in a modern format. The mechanics travel directly.
NDTV: media to ecommerce parallel
NDTV is not ecommerce, but the dataset is informative. Their 55 percent LCP reduction produced a 50 percent decrease in bounce rate. Bounce rate is the upstream metric of every ecommerce conversion. A customer who bounces from the category page does not buy. The bounce-rate-to-conversion-rate translation is not 1:1, but the directional shift is consistent across every published study.
Carpe Diem with Shopify: direct ecommerce case
A Shopify client, optimization work done in partnership with Shopify's performance team. Quantified outcomes: LCP improved 52 percent, CLS improved 41 percent, conversion rate up 5 percent, traffic up 10 percent, revenue up 15 percent. The 10 percent traffic increase is the SEO ranking compound effect; the 5 percent conversion increase is the direct user-experience effect; the 15 percent revenue increase is the multiplicative result of both, plus AOV stability.
This is the case study that maps cleanest onto a Shopify project. The work was theme-level engineering (image optimization, render-blocking script removal, font loading), not a replatform. Comparable to the Core Web Vitals audit work we ship at Sentinu.
Rakuten 24: rigorous A/B test methodology
Rakuten 24 ran a controlled A/B test, 50 percent of traffic to a CWV-optimized landing page versus 50 percent to the original. Same content, same offer, same checkout, single variable was the performance optimization work. The optimized variant produced a 33 percent uplift in revenue per visitor, 61 percent reduction in bounce rate, and 213 percent increase in mobile session duration.
The methodology matters here. Most "Core Web Vitals improved X percent and revenue grew Y percent" claims are confounded by seasonality, marketing changes, or product launches. Rakuten controlled for those with a true A/B test. The 33 percent figure is causally attributable to performance.
Renault: international ecommerce
Renault optimized LCP across 18 country sites simultaneously. The aggregate impact: average LCP improved 14 percent, mobile session duration up 16 percent, lead generation forms completed up 12 percent. The notable detail: improvements were not uniform across countries. Markets with slower baseline performance (emerging market mobile networks) saw larger improvements than markets with already-fast baselines.
Applied to ecommerce: the international audience of a multi-region Shopify store sees different performance profiles. A site that ranks well in the US on Core Web Vitals may be failing in regions with slower mobile networks, and the conversion gap is concentrated there.
What this means for prioritization
If you have to choose where to invest a fixed performance budget, the data points consistently to the same priorities:
1. LCP first. Every published case study has LCP as the metric with the largest correlation to business outcomes. Image preload, image format, render-blocking scripts. This is the single highest-leverage axis.
2. INP second. INP regressions destroy checkout completion. The Trendyol case study attributed a 1 percent click-through uplift to a 50 percent INP improvement, which is modest, but the qualitative damage of a 600ms cart drawer is larger than the metric suggests because it manifests as cart abandonment, not as a metric the customer sees.
3. CLS third in priority but easiest to fix. Layout shift is mechanical to address (image dimensions, reserved space for late-injected content, font display strategy). Low engineering cost, immediate metric improvement, modest conversion impact in isolation but compounds with the other two.
We covered the technical execution in the January audit checklist. The decision framework is: spend the first 60 percent of your performance budget on LCP, 25 percent on INP, 15 percent on CLS. Adjust based on which metric you are failing on hardest.
When Core Web Vitals work does not pay back
The honest counter-cases. Performance investment does not always make sense.
You are already at the green threshold across all three metrics. A site with 1.8s LCP, 150ms INP, 0.05 CLS is in the "good" range across the board. Pushing to 1.2s LCP costs as much as the original work and produces a smaller percentage improvement. The marginal ROI declines sharply once you are passing.
Your traffic is overwhelmingly from a single channel where performance does not affect ranking. A site that gets 95 percent of traffic from email blasts to engaged customers cares less about Core Web Vitals than a site that depends on organic search. The customers click the email link regardless of LCP; the SEO ranking signal does not apply to their journey.
Your conversion rate is already at the high end of your industry. A B2B SaaS company with a 12 percent conversion rate has less room for performance to lift the number than a fashion ecommerce site at 1.5 percent. The ceiling effect matters; you cannot lift 12 percent by 33 percent and end up at 16 percent, because the audience composition starts limiting the addressable improvement.
You have a hard deadline for a different priority. Performance work is months of grinding. If you have a product launch in 4 weeks, ship the launch first. Performance investments pay back over 6 to 12 months and require the page to not change meaningfully during that window, which a launch by definition will.
What we typically see post-engagement
Our Shopify performance engagements deliver, on average across mid-market Plus stores:
| Outcome | Median improvement |
|---|---|
| LCP (mobile, p75) | 2.3 second reduction |
| INP (mobile, p75) | 180ms reduction |
| CLS | 0.12 reduction |
| Mobile conversion rate | 12 to 22 percent uplift |
| Revenue per session | 8 to 18 percent uplift |
| Bounce rate | 15 to 30 percent reduction |
| Lighthouse mobile score | 32 to 78 |
The variability is real. Stores with extremely poor baseline performance see the biggest absolute lifts. Stores that were already passable see smaller percentage improvements but the absolute revenue impact at higher GMV is still material.
The hidden second-order effects
Beyond direct conversion rate improvements, performance work pays back in less-tracked ways:
Ad spend efficiency. Google Ads quality score depends on landing page experience, which includes performance. Better Quality Score means lower cost-per-click and higher ad rank for the same bid. We have seen Google Ads CPC drop 15 to 25 percent after a serious performance project, which compounds the direct conversion lift.
SEO ranking compound. Core Web Vitals are a ranking signal. Better metrics push you up the SERP, which brings more traffic, which gives the conversion improvement more sessions to act on. This is the "1.05^4" compound we discussed earlier.
Support cost reduction. A faster, more stable site generates fewer "the site is broken" support tickets. One enterprise client tracked their tickets categorized as performance complaints; after the optimization work shipped, that category dropped 60 percent. Support team time is real money.
Mobile traffic recovery. Stores with poor mobile performance often have mobile traffic that has organically migrated to desktop because mobile was unusable. After performance work, mobile traffic recovers and starts converting, which is a one-time step function above the ongoing improvement.
What to do tomorrow
If you have not measured your field data, that is the first move. Open Google Search Console, navigate to the Core Web Vitals report, and look at your 28-day field data for mobile users. That is what Google sees and what your customers experience. If you are in the green across LCP, INP, and CLS, you are in the minority and your priorities are elsewhere. If you are in the yellow or red on any metric, you have a quantifiable revenue opportunity.
If you want the technical execution path, the Core Web Vitals audit checklist post walks through the actual diagnostic and remediation steps. If you want someone to run the project, our Shopify speed optimization practice is built around the exact playbook these case studies validate.
FAQ
Can a Shopify theme actually hit good Core Web Vitals scores?
Yes, but it requires discipline. The default Dawn theme on a fresh Shopify install passes Core Web Vitals comfortably. The reason most live Shopify stores fail is the accumulation of apps, the over-installation of tracking pixels, and theme customizations that did not respect performance budgets. The platform is not the constraint.
How fast can I expect to see results from performance work?
Field data in Search Console updates on a 28-day rolling window, so meaningful field data takes about 30 days post-launch. Conversion rate impact shows up faster, often within 2 to 4 weeks, because conversion changes do not need a rolling-window calculation. SEO ranking impact is the slowest, 6 to 12 weeks for measurable position changes.
Is Core Web Vitals more important than other conversion factors?
It is one factor among many: pricing, product fit, brand trust, checkout UX, payment options, return policy. Performance is among the highest-ROI of the factors a developer can affect, but no amount of performance work fixes a fundamentally weak offer. Treat it as a multiplier on your existing strengths, not a substitute for them.
Do these numbers apply to B2B Shopify stores?
The mechanism applies. The magnitudes shift. B2B buyers are more tolerant of slow sites because they are not impulse buying, but they are less tolerant of broken-feeling interactions (high CLS, slow INP). For B2B, INP and CLS often matter more than LCP because the user is doing work on the site, not browsing. We covered B2B Shopify in our Shopify Plus B2B post.
Should I prioritize performance over new features?
If you are losing measurable revenue to performance issues, fix performance first. New features only matter if customers can complete the purchase journey. We have seen teams ship six months of features to a site that converted at 1.2 percent when industry benchmark was 2.5 percent; the feature work was wasted because the funnel leaked everywhere. Fix the leaks, then ship features.
How do I know if my LCP is really 2.5s and not the synthetic number?
Synthetic data (Lighthouse, PageSpeed Insights lab result) lies. Field data (Google Search Console, Chrome User Experience Report) is what matters. The synthetic number is a development-time tool; field data is what affects your rankings and your customers. Always optimize against field data.
What if my CMS or platform makes performance hard?
Then the platform decision is the performance decision. We covered the Hydrogen vs Next.js choice for headless Shopify storefronts because that decision substantially affects what performance ceiling you can reach. For sites stuck on legacy platforms with structural performance issues, the conversation often shifts from "optimize the existing site" to "replatform" within a year.
Where to take this next
If the numbers in this post made the case in your head and you are now wondering what your specific Shopify store would gain from a focused performance engagement, that is the question our Shopify speed optimization practice answers concretely. We measure your current field data, project the conversion uplift against your baseline, and scope the engineering to capture it. If the broader project is a replatform rather than an optimization, our Hydrogen vs Next.js post covers the architectural framing.
Related Topics
Related posts
View all articles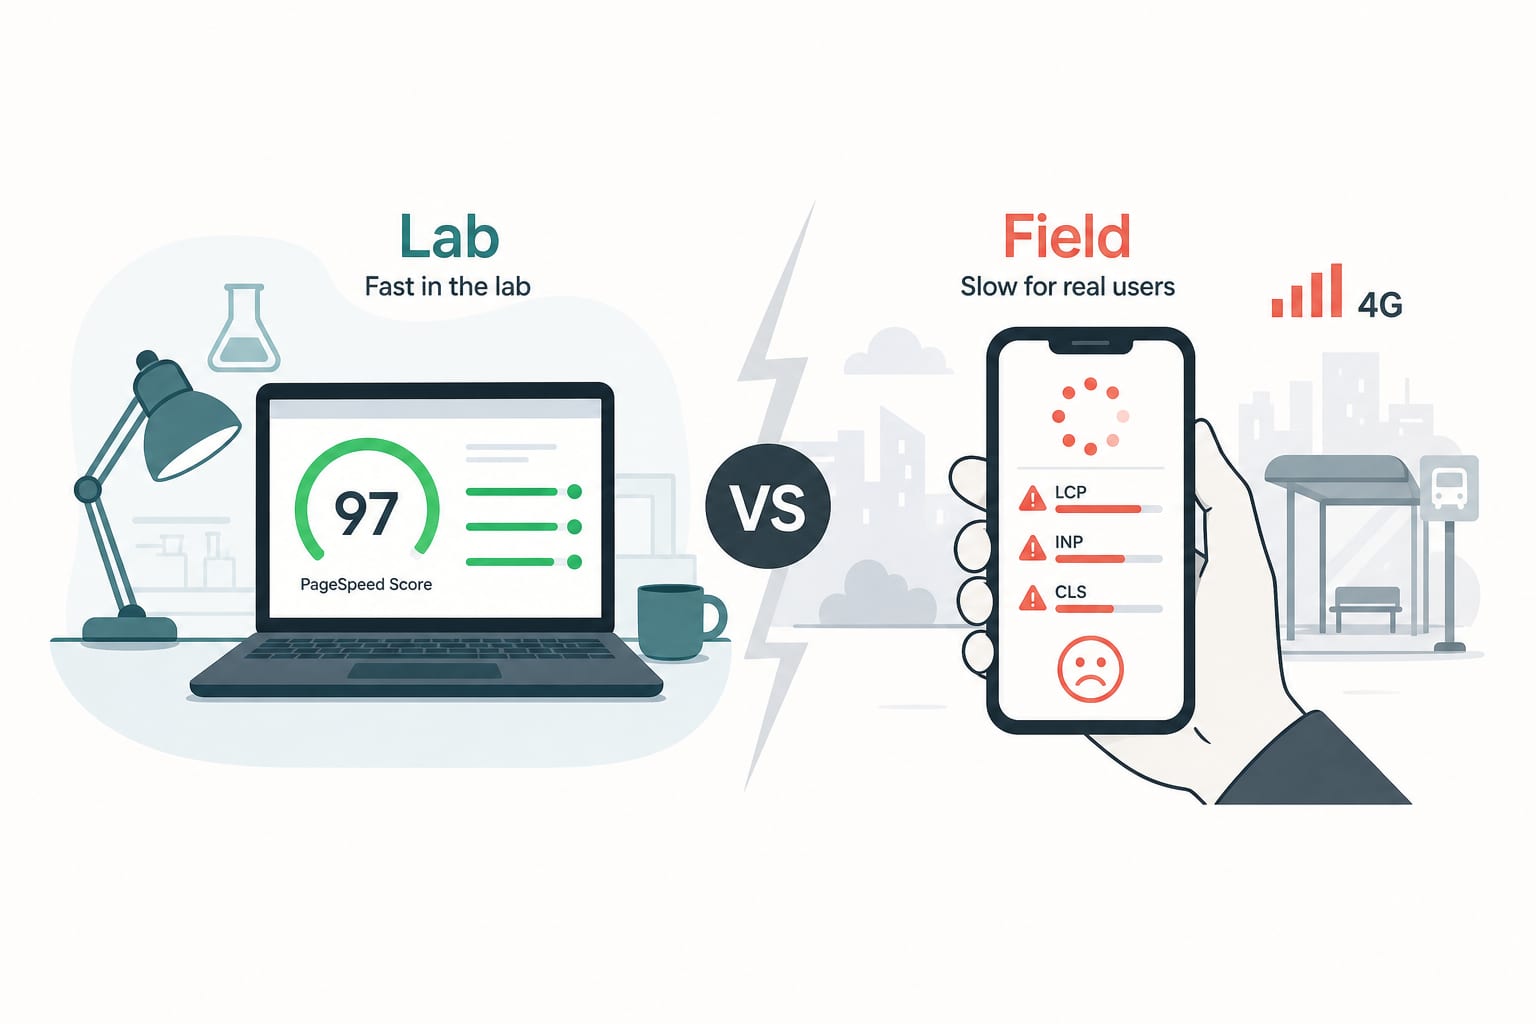
Shopify DevelopmentJan 13, 2026
Shopify Core Web Vitals in 2026: The Audit Checklist We Run Before Quoting a Project
A senior engineer's audit checklist for Shopify Core Web Vitals in 2026. How to diagnose INP, LCP and CLS issues, find the apps that are bleeding your performance, and fix them without breaking the store.
11 min read
Growth StrategyMay 21, 2026
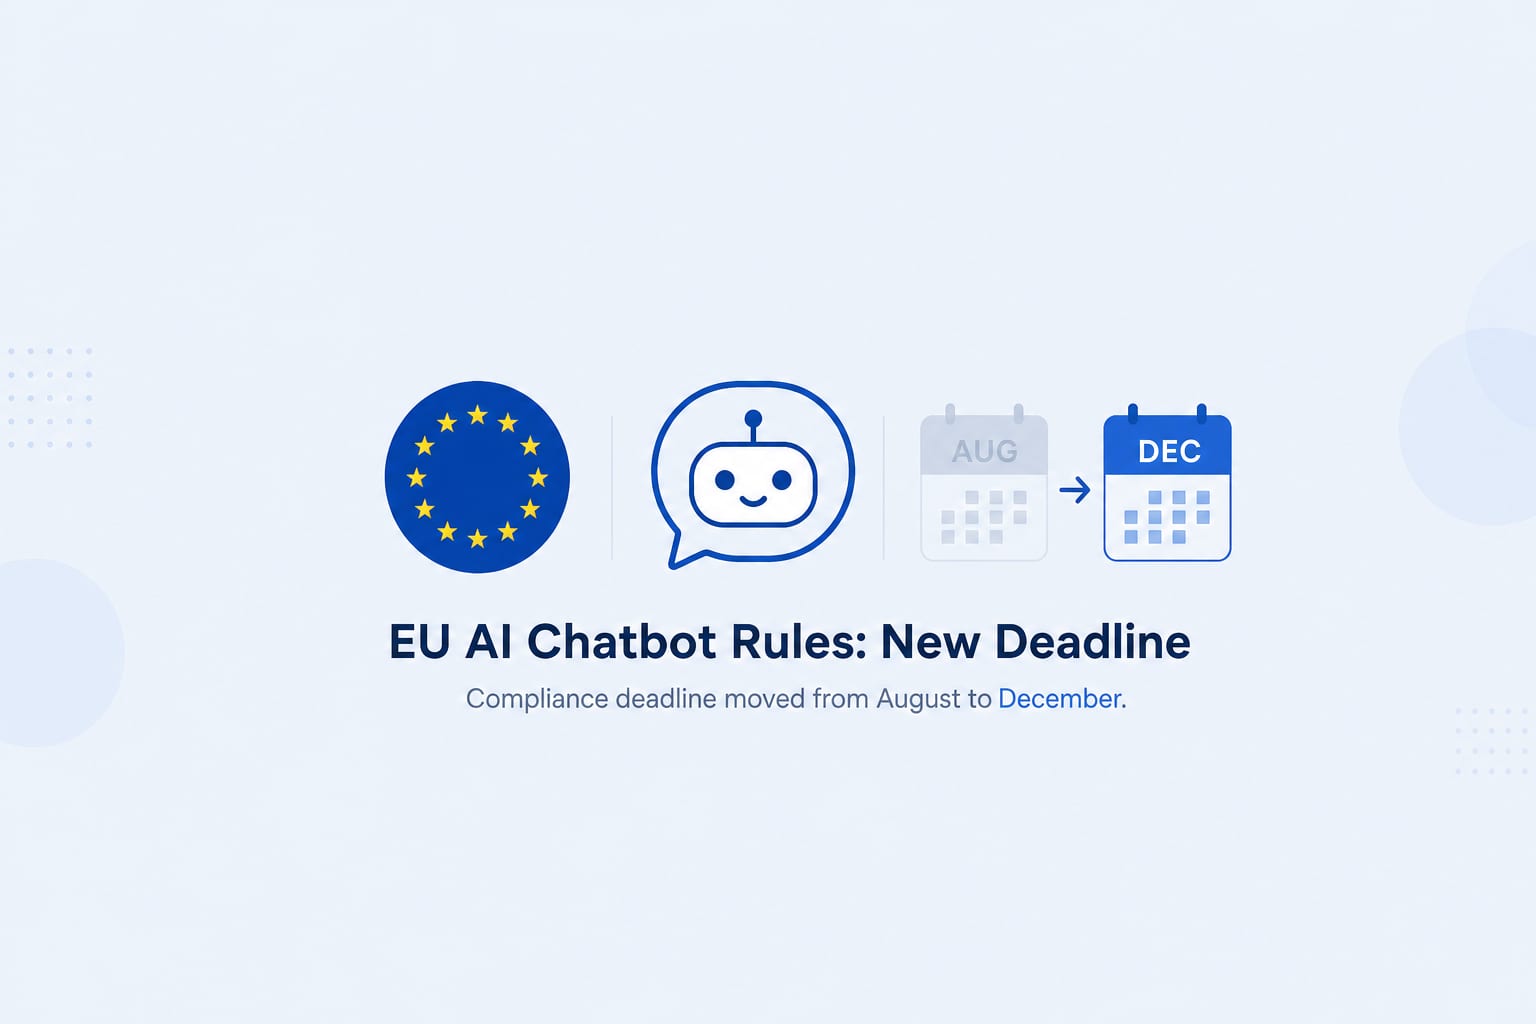
EU AI Act for Ecommerce After the May 2026 Delay: What's Still Mandatory, What Got Pushed, and What to Do Before December
On May 7, 2026, EU lawmakers agreed to delay parts of the AI Act. But the chatbot transparency rules were not delayed much. Here is what an ecommerce store actually has to do, and by when.
11 min read
Technical SEOApr 7, 2026
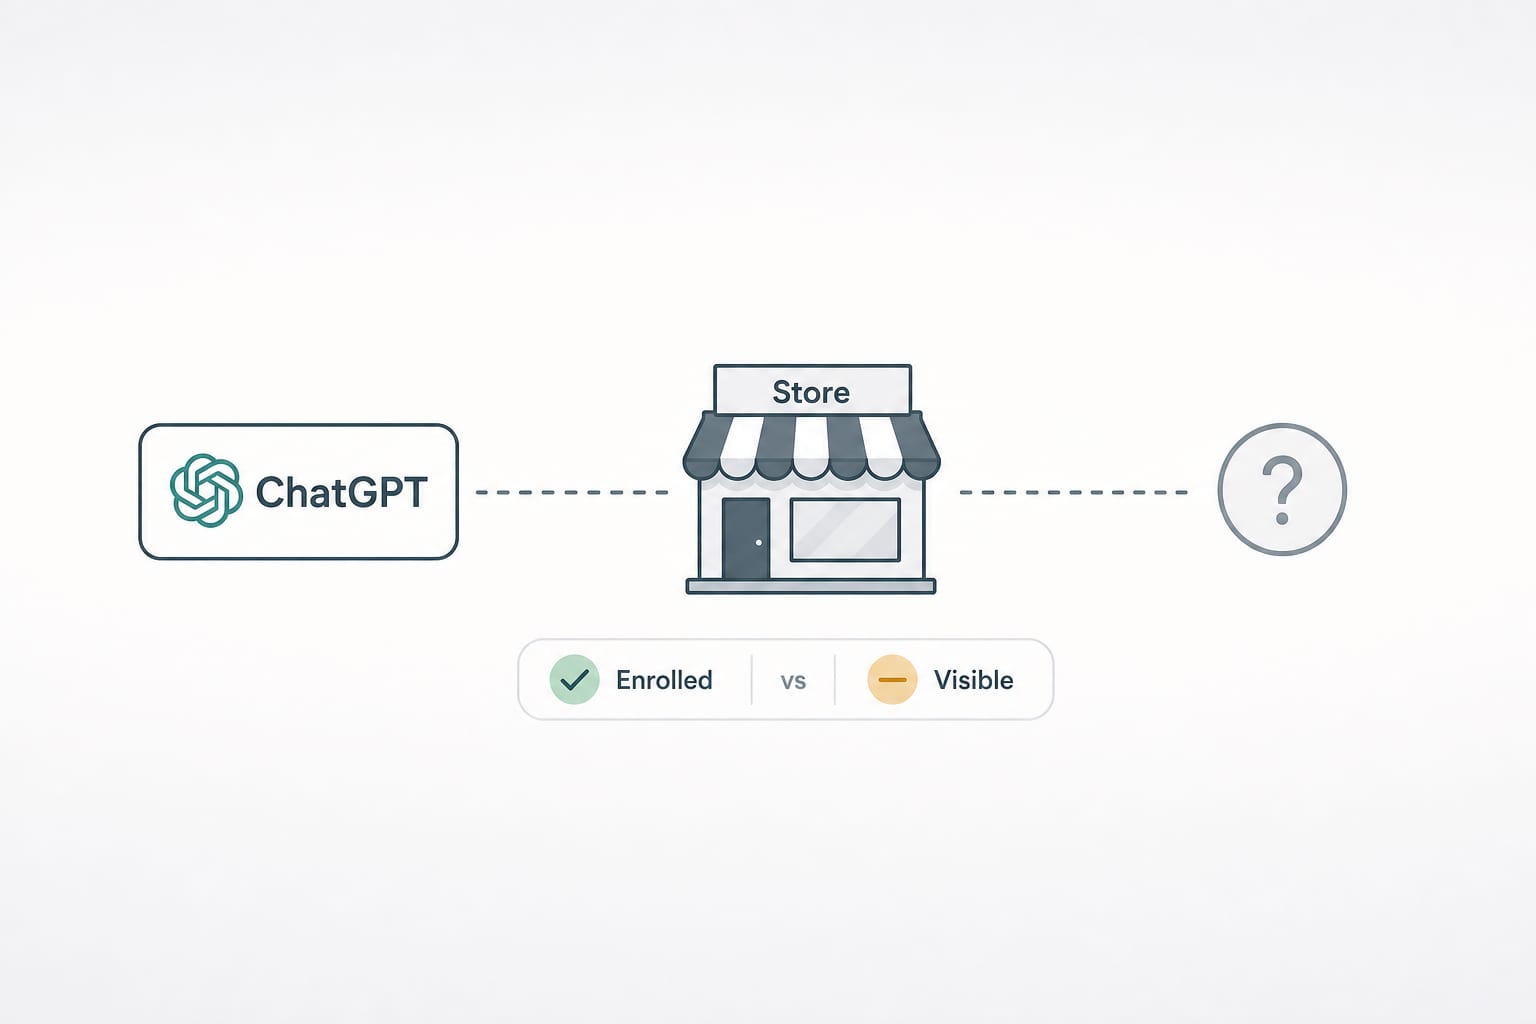
Is Your Shopify Store Discoverable Inside ChatGPT? A 10-Minute Audit for Agentic Storefronts
On March 24, 2026, Shopify made 5.6 million stores discoverable to AI agents by default. Here is the 10-minute audit we run to tell whether your store is actually getting recommended, or just enrolled.
13 min read